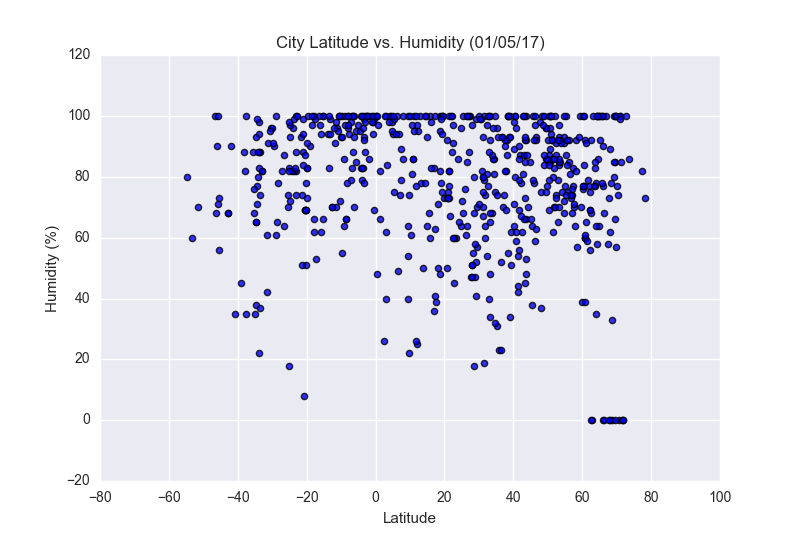
Here we have humidity plotted against latitude. Visually, it seems like the data is fairly
evenly distributed without much of a pattern - although, it does seem like the world's deserts may
be visible in this representation, clustered around -20* and between 20*-40* of latitude.